
Volcanic Gas Emissions
 Download
Student Worksheet
Directions
1. Download the worksheet using the link above.
2. Print a paper copy or open the .rtf file in your word processor.
3. Navigate through this activity by carefully reading everything and watching all of the videos.
4. When you see this symbol: ![]() take a minute to ponder the question asked.
take a minute to ponder the question asked.
5. When you see this symbol: ![]() write your answer on your worksheet or on a separate piece of paper.
write your answer on your worksheet or on a separate piece of paper.
6. If you are unsure what a word means, scroll over it to see its definition.
7. If you need to see a larger version of an image, click on it.
Let’s get started!

Mount St. Helens Science and Learning Center
You’ve been assigned to the Mount St. Helens Science and Learning Center to work with members of the volcano monitoring team from the USGS Cascades Volcano Observatory. You have a lot to learn because volcanoes are very complex, and there is no one thing that tells us everything we need to know about a volcano’s behavior. As a trainee, your job is to find out about gas emissions and report what you discover to the team. Along with other observations, such as deformation and seismicity (which you can learn about in other lessons), gas emissions monitoring can be an important indication of an approaching eruption.

Stop and Think: What can the gas from a volcano tell us about what is happening inside a volcano?
Part 1. Introduction to Volcanic Gas
Magma isn’t just made of molten rock. Magma is often a mixture of molten rock, crystallized minerals, and dissolved gases. In a way, magma is similar to soda, which also contains dissolved gas that bubbles out when you open the can.
Click through the slideshow below to learn more about volcanic gas. Answer Question 1 below.


 next
prev
next
prev

1 - In your own words, describe how gas can create explosive volcanic eruptions.
Part 2. Monitoring Gas Emissions
Monitoring volcanic gas emissions is very exciting! Understanding changes in gas emissions can help scientists to understand changes in the properties of magma beneath or inside a volcano. If lots of gas-rich magma is accumulating at shallow depths inside the volcano, chances are higher that the volcano may have an explosion in its near future!

Figure 1: Measuring gas emissions from an airplane. Photo credit: S.R. Brantley on June 16, 1982
It is very important to monitor gas emissions at a volcano on a regular basis. Conditions can change very quickly, so keeping a close watch on gas emissions can alert scientists to sudden and important changes in the properties of the magma. Some of these changes can sometimes indicate an approaching eruption! Scientists often take measurements of gas plumes like the one shown in Figure 1 from airplanes using spectrometers. Spectrometers measure the composition (what kinds) and concentration (how much) of gases in a volcanic gas plume by determining the spectra of light missing (filtered out) in light that has passed through a gas plume.
Watch the following video where USGS team member Cynthia Werner explains more about gas emissions monitoring. Use the video to answer Questions 2-4.
2 - In your own words, describe what is happening in Figures 2a, 2b, and 2c below. If you need help, watch the video again.

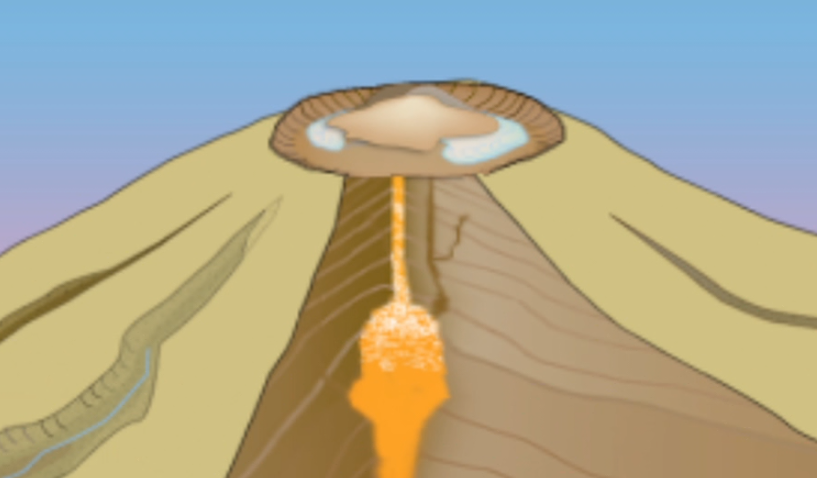
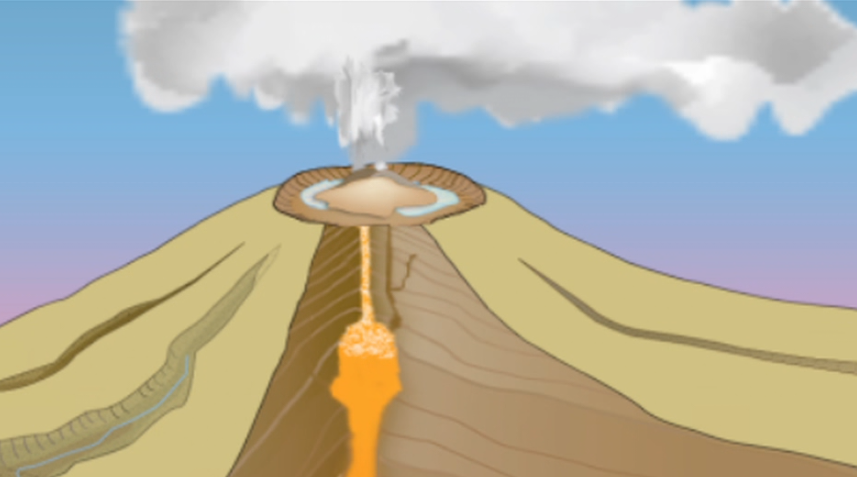 Figure 2a Figure 2b Figure 2c
3 - What did you find most interesting about the video?
4 - In your own words, explain why it is important to monitor gases on a routine basis at active volcanoes like Mount St. Helens.
Active volcanoes can emit different types of gases such as such as water vapor (H2O), sulfur dioxide (SO2), carbon dioxide (CO2), hydrogen sulfide (H2S), and others. While water vapor is typically the most abundant gas emitted, scientists keep a close eye on the amount of sulfur dioxide (SO2) emitted because of its association with the magma. Scientists measure gas flux, which is the amount of gas emitted per day. Gas flux typically measured in tonnes per day. A tonne is equivalent to 1000 kilograms or about 2200 pounds.
Changes in sulfur dioxide (SO2) flux can indicate a change in the properties of the magma beneath a volcano. These properties include:
1. The amount of magma inside the volcano
2. The depth of magma below the ground surface
3. The amount of gas in magma
Click through the slideshow below to see cartoons of how these properties relate to the amount of gas emitted by the volcano. Answer Question 5.


 next
prev
next
prev
5 - Which of the following do you think could be the cause of an increase in gas flux at a volcano? Mark all that apply.
a. Magma is entering the volcano more quickly than before.
b. Magma is no longer entering the volcano from below.
c. Magma is moving closer to the surface of the volcano.
d. Magma is no longer moving towards the surface of the volcano.
e.The magma in the volcano contains significantly less dissolved gas than before.
f. The magma in the volcano contains significantly more dissolved gas than before.
PART 3. ANALYZE THE DATA
Now it is your turn to be the scientist! The graph in Figure 3 below shows the sulfur dioxide (SO2) gas flux at Mount St. Helens from 1980 to 1988. Use Figure 3 below to answer Questions 6 and 7.
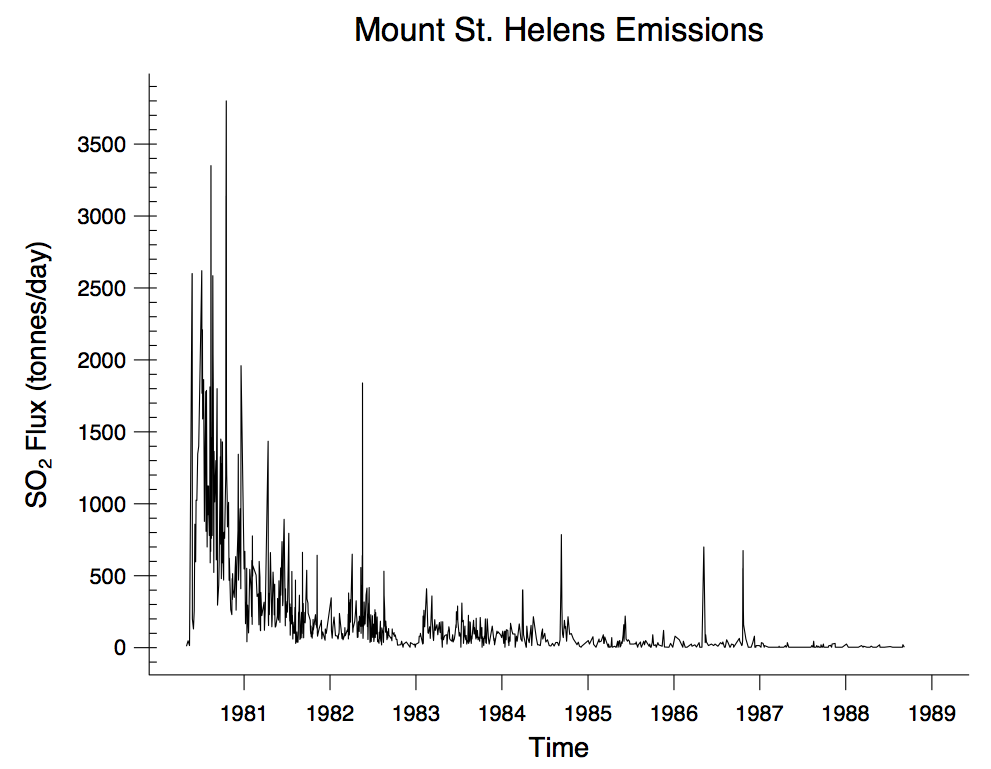
6 - Use Figure 3 to describe the overall pattern of sulfur dioxide flux emissions between 1980 and 1988. In other words, did the sulfur dioxide flux increase or decrease (or both) through time?
7 - Are there any deviations from the overall pattern in the sulfur dioxide flux from 1980 to 1988? In other words, were there any sudden increases or decreases in sulfur dioxide flux that don't match the overall pattern? If so, when did they happen?
Scientists interpret the overall drop in SO2 flux after 1980 as resulting from a decreased rate of magma supply. In other words, Mount St. Helens was still filling with fresh magma from beneath, but not as quickly as it had before. Even though the SO2 gas flux was decreasing overall, sometimes the gas flux rapidly changed. The graph in Figure 4 below shows the SO2 flux in 1982 so that you can observe it in more detail. Use Figure 4 to answer Questions 8 and 9.

8 - Use Figure 4 to describe the pattern of sulfur dioxide flux in 1982.
9 - What do you think is the relationship between the pattern of sulfur dioxide flux in 1982 and changes in the status of the magma beneath the volcano during this time? Explain why you think so.
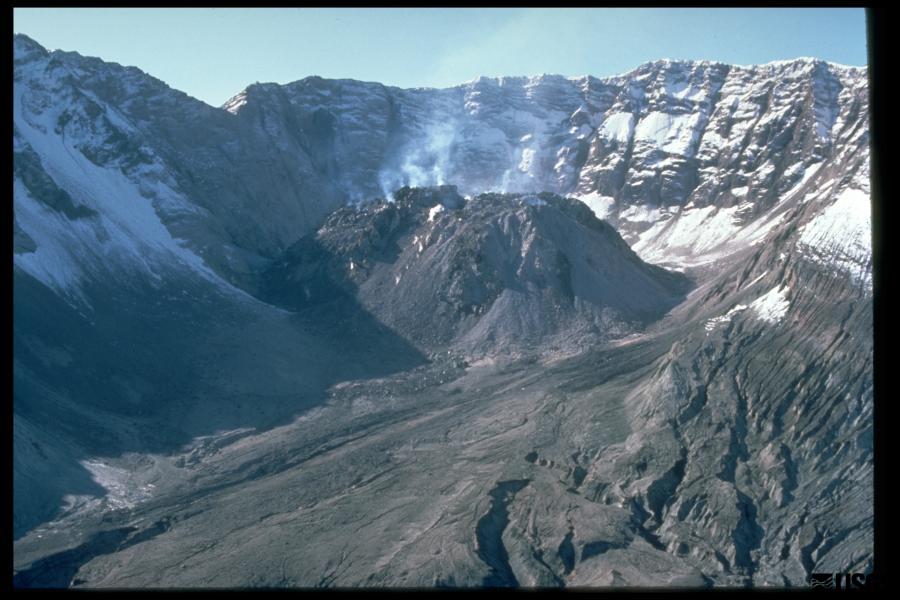
The lava dome in the crater of Mount St. Helens in 1984. Photo credit: USGS, Lyn Topinka.
This activity preceded a new phase of lava dome growth in 1982. From 1980 to 1986, Mount St. Helens’s activity alternated between small steam explosions and calm eruptions of slow-moving flows of thick, blocky lava, forming a lava dome. Eventually the lava dome grew to a height of 305 meters (about 1000 feet), which is almost as tall as the Empire State Building in New York City!
 Congratulations!

You’ve completed your initial training and are now a part of the expert volcano monitoring team! You can now proceed to lessons on volcano deformation or seismicity. If you’ve finished all three, let’s put all of this information to good use and help forecast if an eruption is likely to occur in this “Forecasting an Eruption” lesson!
This lesson was prepared through a collaborative effort by the Mount St. Helens Institute and the US Forest Service, Mount St. Helens National Volcanic Monument. Activity authorship and graphic design is by Sonja Melander (Mount St. Helens Institute), Phillip Wilson (Western Washington University), Peter Frenzen (US Forest Service), and Abigail Groskopf (Mount St. Helens Institute). Special thanks are due to Carolyn Driedger, Liz Westby, Seth Moran and Dan Dzurisin at the USGS Cascades Volcano Observatory for use of their data and for helpful reviews.
This project was made possible through the support of the US Forest Service’s Children’s Forest Program, Gifford Pinchot National Forest, Chevron, Gravitate and Mount St. Helens Institute donors.

