
Forecasting an Eruption
 Download
Student Worksheet
Directions
1. Complete the lessons on some different types of monitoring: seismicity , volcano deformation, and gas emissions . These lessons will give you the knowledge you need to forecast the future activity of a volcano.
2. Download the worksheet using the link above.
3. Print a paper copy or open the .rtf file in your word processor.
4. Navigate through this activity by carefully reading everything and watching all of the videos.
5. When you see this symbol: ![]() take a minute to ponder the question asked.
take a minute to ponder the question asked.
6. When you see this symbol: ![]() write your answer on your worksheet or on a separate piece of paper.
write your answer on your worksheet or on a separate piece of paper.
7. If you are unsure what a word means, scroll over it to see its definition.
8. If you need to see a larger version of an image, click on it.
Let’s get started!

Mount St. Helens Science and Learning Center
You’ve been assigned to the Mount St. Helens Science and Learning Center to work with members of the volcano monitoring team from the USGS Cascades Volcano Observatory. You have a lot to learn because volcanoes are very complex, and there is no one thing that tells us everything we need to know about a volcano’s behavior. As a trainee, your job is to examine several different kinds of monitoring information at the same time to determine what is happening at the volcano and, if it is active, to forecast the likelihood of an eruption in the near future!

Stop and Think: Why is it important to be able to anticipate when a volcano will erupt and the type of eruptive activity that can be expected?
Part 1. Examine Monitoring Data
Let’s put our knowledge about volcano monitoring to work! The graphs in Figures 1, 2, and 3 show different types of monitoring data from two different made-up scenarios at Mount St. Helens.
Monitoring Seismicity
Seismicity describes when and where earthquakes occur. The most common earthquakes at active volcanoes like Mount St. Helens are rock-breaking earthquakes which occur as a result of rock fracturing as magma forces its way to the surface.
Use Figure 1 below to answer Question 1 on your worksheet. The monitoring data from Scenario 1 is marked in green. The monitoring data from Scenario 2 is marked in blue.


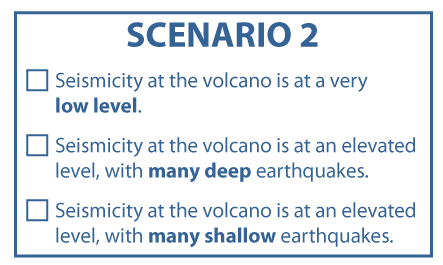
1 - For both Scenarios 1 and 2, choose which statement best describes the seismicity from the options below.

Monitoring Deformation
Tilt is a measure of deformation, which the change in shape of the surface caused by the magma body beneath it. When magma forces its way into the volcano, the ground surface above it swells upward and inflates. When the supply of underlying magma decreases the ground surface relaxes due to decreasing pressure beneath it and deflates.
Use Figure 2 below to answer Question 2 on your worksheet. The monitoring data from Scenario 1 is marked in green. The monitoring data from Scenario 2 is marked in blue.
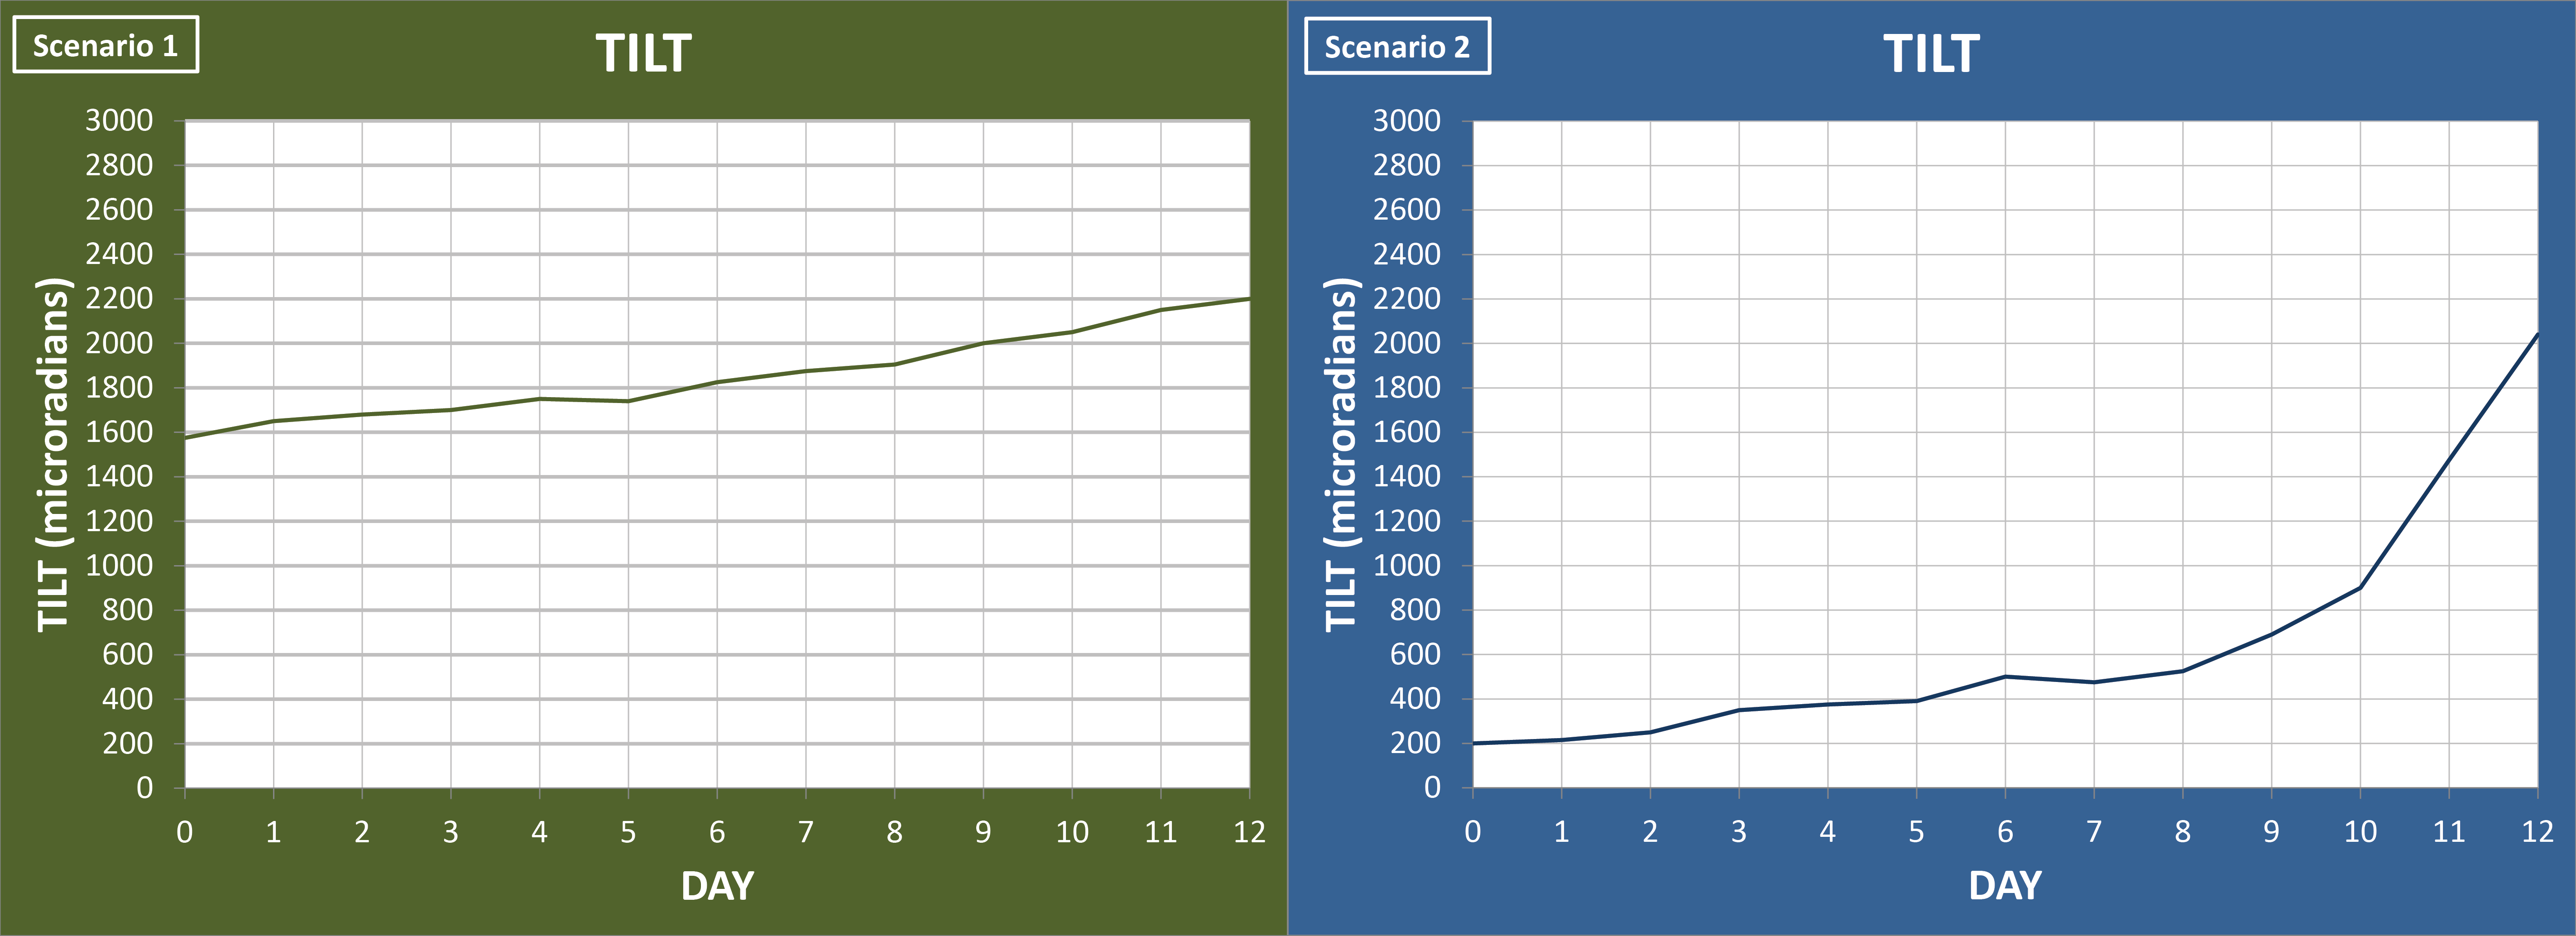
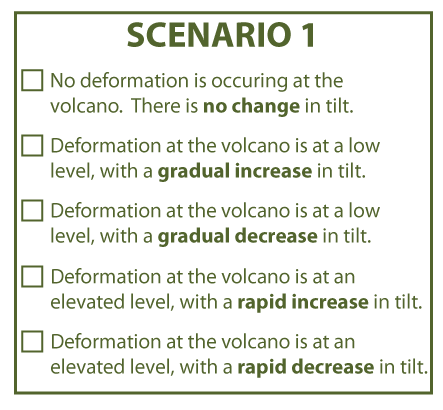
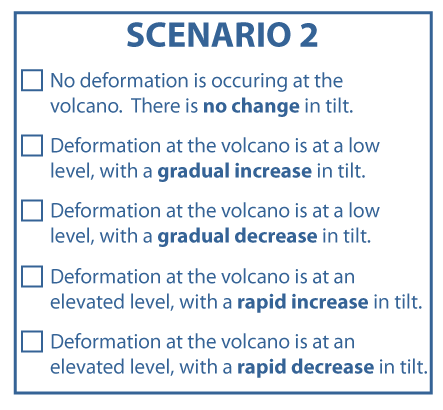
2 - For both Scenarios 1 and 2, choose which statement best describes the deformation using the options below.
Monitoring Gas Emissions
Sulfur dioxide (SO2) flux is a measure of how much SO2 gas is being produced and released into the atmosphere by the volcano. SO2 flux can be an indication of the state of the magma beneath the volcano. An increase in SO2 flux may indicate that a supply of fresh, gas-rich magma is moving into the magma reservoir beneath or within the volcano.
Use Figure 3 below to answer Question 3 on your worksheet. The monitoring data from Scenario 1 is marked in green. The monitoring data from Scenario 2 is marked in blue.
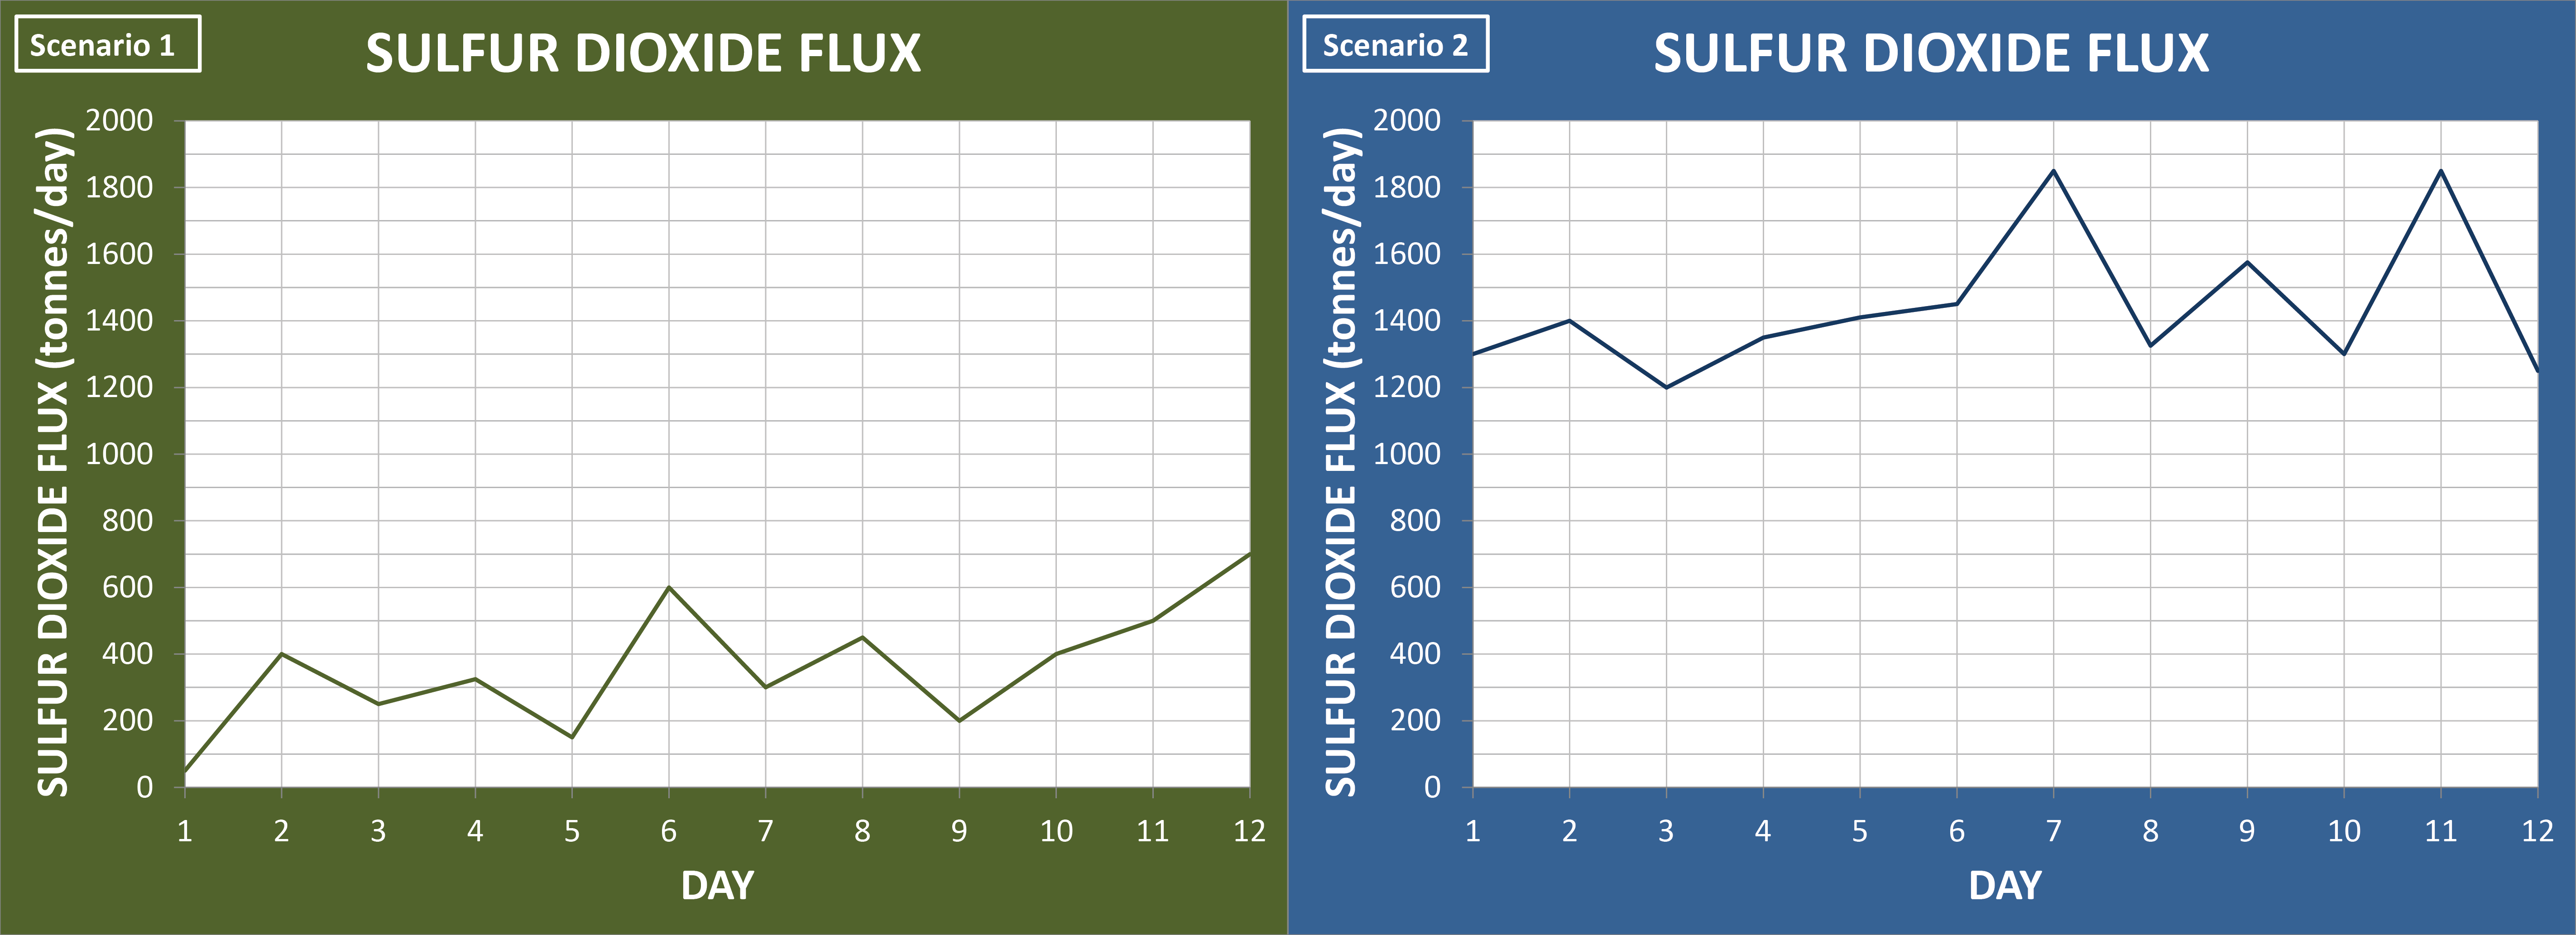
3 - For both Scenarios 1 and 2, choose which statement best describes the sulfur dioxide emissions using the options below.
Compare Scenarios
Recall what you learned from your other activities about what seismicity, deformation, and gas emissions can tell you about the status of magma within or beneath a volcano.
-If monitoring data indicates that the magma in a volcano is moving to shallower depths, pressurizing, and contains a significant amount of gas, then chances are higher that an eruption may occur soon.
-If monitoring data indicates that the magma in a volcano is still very deep, slowly depressurizing, or doesn’t contain a lot of gas, the chances are lower that an eruption may occur soon.
Answer Question 4.
4 - Which of the two time periods (Scenario 1 or 2) shows more signs of approaching eruptive activity? Justify your answer using information from the seismicity, deformation, and gas monitoring graphs.
Part 2. Volcano Alert System
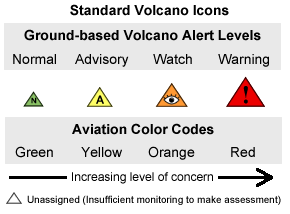
Figure 4: Standard Volcano Alert Levels
Now that you’ve analyzed the monitoring data, it’s time to share that information with the world! Your colleagues at the USGS use a standardized series of Volcano Alert Levels to notify people about a volcano’s status. The objective of the Volcano Alert System is to inform people who live in potentially hazardous areas of the current status and severity of potential volcanic hazards.
The USGS alert-notification system has four different Volcano Alert Levels. The Alert Level of a volcano depends on its current activity. The alert levels are very similar to the alert system used by the National Weather Service to warn people about potentially hazardous weather.
Let’s see what’s going on right now! Click on the USGS logo to visit the USGS Volcano Hazards webpage and observe the current Alert Levels of volcanoes in the United States. Answer Questions 5 and 6 on the worksheet. ![]()
5 - What is the current Volcano Alert Level at Mount St. Helens?
6 - Find a volcano that is not currently at the normal level. List the name, Alert Level, and color code of this volcano.
Part 3. Set the Alert Level
Remember that you are working with a team of scientists from the USGS Cascades Volcano Observatory (CVO). Part of your job is to inform public officials of the status of Mount St. Helens using the correct Volcano Alert Level.
Click on the USGS logo below to learn more about Volcano Alert Levels. Read the descriptions of the Alert Levels on the USGS Volcano Hazards webpage. Look closely, you’ll need this information to answer your next question! ![]()
You need to select the appropriate Alert Level for the two scenarios you examined earlier in this activity. Luckily, your colleagues at CVO have summarized the data for you in volcanic activity reports below. Read the reports and answer Question 7 below.
SCENARIO 1 SCENARIO 2

7 - What Volcano Alert Level would you recommend assigning to the volcano for a) Scenario 1 and b) Scenario 2? Justify your choice for the Alert Level for both using what you know about the monitoring data.
Part 3. Inform the Public about Hazards
Your job is to inform the public about the activity at and possible hazards from Mount St. Helens. To give the public the information they need, you need to understand the different types of volcanic hazards: what they are and what areas they might affect. Look through the slideshows below to learn more about three main types of volcanic hazards at Mount St. Helens. Use this information to answer Question 8.
Tephra


 next
prev
next
prev
Lahar


 next
prev
next
prev
Pyroclastic Flow

 next
prev
next
prev
8 - Using what you learned in the slideshows above, draw lines to match the name of a hazard with a description of the hazard and where the hazard affects.

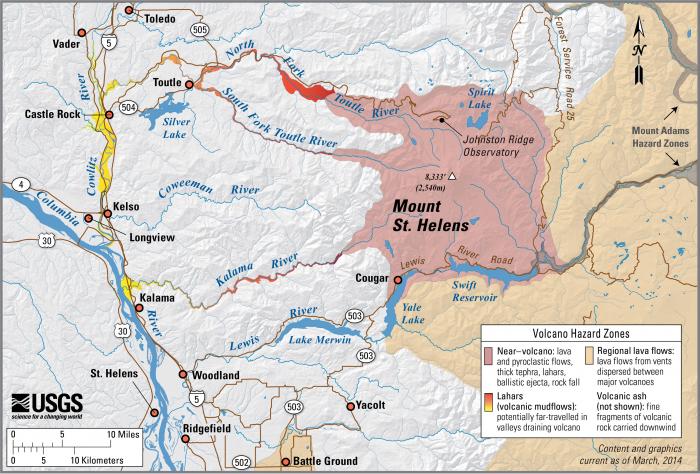
Figure 5: Mount St. Helens Hazard Zones Map
Now that you know about the main types of hazards at volcanoes like Mount St. Helens, you need to find out what areas are at risk from volcanic hazards. Your colleagues at CVO have already created a hazard map for the area around Mount St. Helens. This map shows hazard zones which are likely to be affected by different kinds of volcanic activity, should an eruption occur. Take a close look at the hazard zone map to the right and answer Question 9.
9 - Find the town of Toutle, Washington. What type or types of volcanic hazards might affect the people in Toutle?
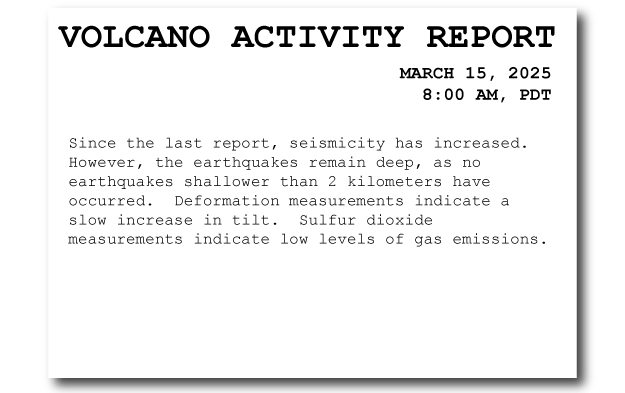
 Conditions can change quickly at a volcano! Just a few hours after you received the last volcano activity report, you receive updated information from your colleagues at CVO. Click on the report to the right to read it.
 Remember that it is early spring, and Mount St. Helens is still covered in a significant amount of ice and snow. If Mount St. Helens erupts, the snow and ice could melt rapidly and create a lahar.
You are asked by the emergency response officials in Toutle, Washington to give a recommendation to the people of Toutle. Recall your answer to Question 9 and answer Question 10.
10 - What would you recommend that emergency response officials say to the people in Toutle so that they can remain safe from volcanic hazards?
 Thank you for all of your hard work and dedication! Because of your team’s careful observations and warnings, the people who live, work, and play near Mount St. Helens have the opportunity to prepare for a future eruption, to stay informed, and, if necessary, to temporarily evacuate to a safe location so they can stay out of harm’s way should it become necessary to do so.
This lesson was prepared through a collaborative effort by the Mount St. Helens Institute and the US Forest Service, Mount St. Helens National Volcanic Monument. Activity authorship and graphic design is by Sonja Melander (Mount St. Helens Institute), Phillip Wilson (Western Washington University), Peter Frenzen (US Forest Service), and Abigail Groskopf (Mount St. Helens Institute). Special thanks are due to Carolyn Driedger, Liz Westby, Seth Moran and Dan Dzurisin at the USGS Cascades Volcano Observatory for use of their data and for helpful reviews.
This project was made possible through the support of the US Forest Service’s Children’s Forest Program, Gifford Pinchot National Forest, Chevron, Gravitate and Mount St. Helens Institute donors.

