
Volcano Seismicity
 Download
Student Worksheet
Directions
1. Download the worksheet using the link above.
2. Print a paper copy or open the .rtf file in your word processor.
3. Navigate through this activity by carefully reading everything and watching all of the videos.
4. When you see this symbol: ![]() take a minute to ponder the question asked.
take a minute to ponder the question asked.
5. When you see this symbol: ![]() write your answer on your worksheet or on a separate piece of paper.
write your answer on your worksheet or on a separate piece of paper.
6. If you are unsure what a word means, scroll over it to see its definition.
7. If you need to see a larger version of an image, click on it.
Let’s get started!

Mount St. Helens Science and Learning Center
You’ve been assigned to the Mount St. Helens Science and Learning Center to work with members of the volcano monitoring team from the USGS Cascades Volcano Observatory. You have a lot to learn because volcanoes are very complex, and there is no one thing that tells us everything we need to know about a volcano’s behavior. As a trainee, your job is to find out about seismicity and report what you discover to the team. Seismicity is a term typically used to describe the location and frequency (where and how often) of earthquakes. Along with other observations, such as deformation and gas emissions (which you can learn about in other lessons), seismicity can be an important and early indication of an approaching eruption.

Stop and Think: What could cause an earthquake at a volcano?
Part 1. Introduction to Volcanic Earthquakes
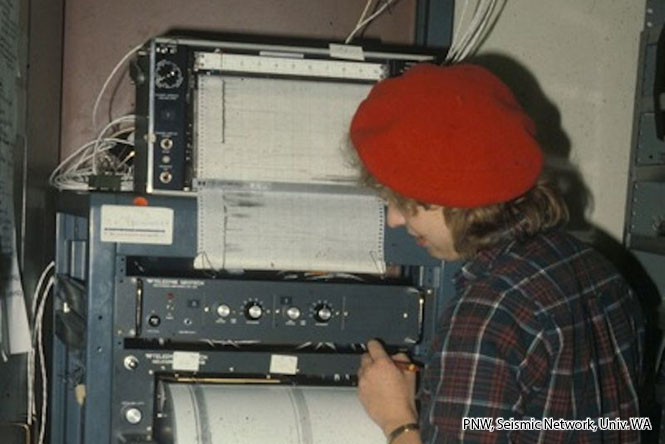
Figure 1: Scientist observing the seismic records from Mount St. Helens in the weeks before the May 18, 1980 eruption. Photo credit: Pacific Northwest Seismic Network, Univ. WA
Monitoring earthquakes at volcanoes is very important. Scientists detect and record earthquakes at active volcanoes like Mount St. Helens using instruments called seismometers. Sometimes these earthquakes are made when rock fractures and breaks as magma is moving inside a volcano. Detecting these types of rock-breaking earthquakes lets scientists know that magma is on the move!
Watch the following video where USGS team member Seth Moran will tell you more about monitoring seismicity and the volcano seismic network and Answer Questions 1 and 2 on your worksheet.

1 - The job of the seismic network at Mount St Helens is to detect all of the possible signs that might be pointing towards what?
2 - What did you find most interesting about the video?
In the video, Seth Moran explained that earthquakes at volcanoes can sometimes indicate that magma is moving within or beneath the volcano. However, not all seismic signals (ground shaking detected by a seismometer) are related to magma movement or volcanic activity at all. Figure 2 below shows some of the different ways seismic signals can be generated in volcanic areas.

Seismic signals can be generated by sources that are unrelated to volcanic activity. At Mount St. Helens, sources that cause minor ground shaking include vibrations from helicopters, animal movement, avalanches, and rockfalls. Instruments also commonly record tectonic earthquakes generated by movement along tectonic faults in the earth’s crust that have nothing to do with the volcano.
Volcanic eruptions also produce seismic signals. Pyroclastic flows and lahars shake the ground as they transport rocks and debris. Explosions also send vibrations into the ground which are detectable on seismometers.
The types of earthquakes that scientists are generally most interested in using to forecast volcanic eruptions are those that are made inside a volcano from the movement of magma associated with an approaching eruption. Watch the video below to learn more about these kinds of volcanic earthquakes and answer Question 3.
3 - Is shallow or deep seismicity more likely to indicate an approaching eruption?
Rock-breaking earthquakes are common at active volcanoes like Mount St. Helens. This type of earthquake is produced when rocks fracture as magma forces its way towards the surface. Earthquakes can also be made as magma beneath or within the volcano pressurizes the magma and surrounding rock. Both types of earthquakes show that magma is on the move beneath or within a volcano.
Scientists need to monitor the location and depth of earthquakes to determine whether it’s likely an eruption is approaching. Deep earthquakes (about 3 km (1.9 miles) beneath the surface or deeper) can be a sign that magma is rising beneath the volcano. Shallow earthquakes (about 2 km (1.2 miles) or shallower) can be a sign that magma is moving inside the volcano and closer to the ground surface. The closer magma is to the surface, the more likely it is than an eruption may occur soon.
Think about what you have learned about the different sources of seismic signals and answer Question 4.
4 - Do all earthquakes in volcanic areas indicate an approaching eruption? Explain why or why not.
Part 2: Analyzing Seismic Data
It’s time to put your new knowledge to work! You will analyze Mount St. Helens seismic data recorded during three different years (1982, 1998, and 2004).
Figures 3, 6, and 7 show the seismicity at Mount St. Helens between 1980 and 2012. Each circle outlined in black represents a volcanic earthquake. The y-axis of the graph represents the depth of each earthquake below ground in kilometers. Shallow earthquakes (located near the top of the graph) occurred close to the ground surface. The x-axis of the graph represents when the earthquake occurred, shown by year.
1982 Seismicity
Look closely at the seismicity graph in Figure 3 below and answer Questions 5 and 6 about the seismicity in 1982.
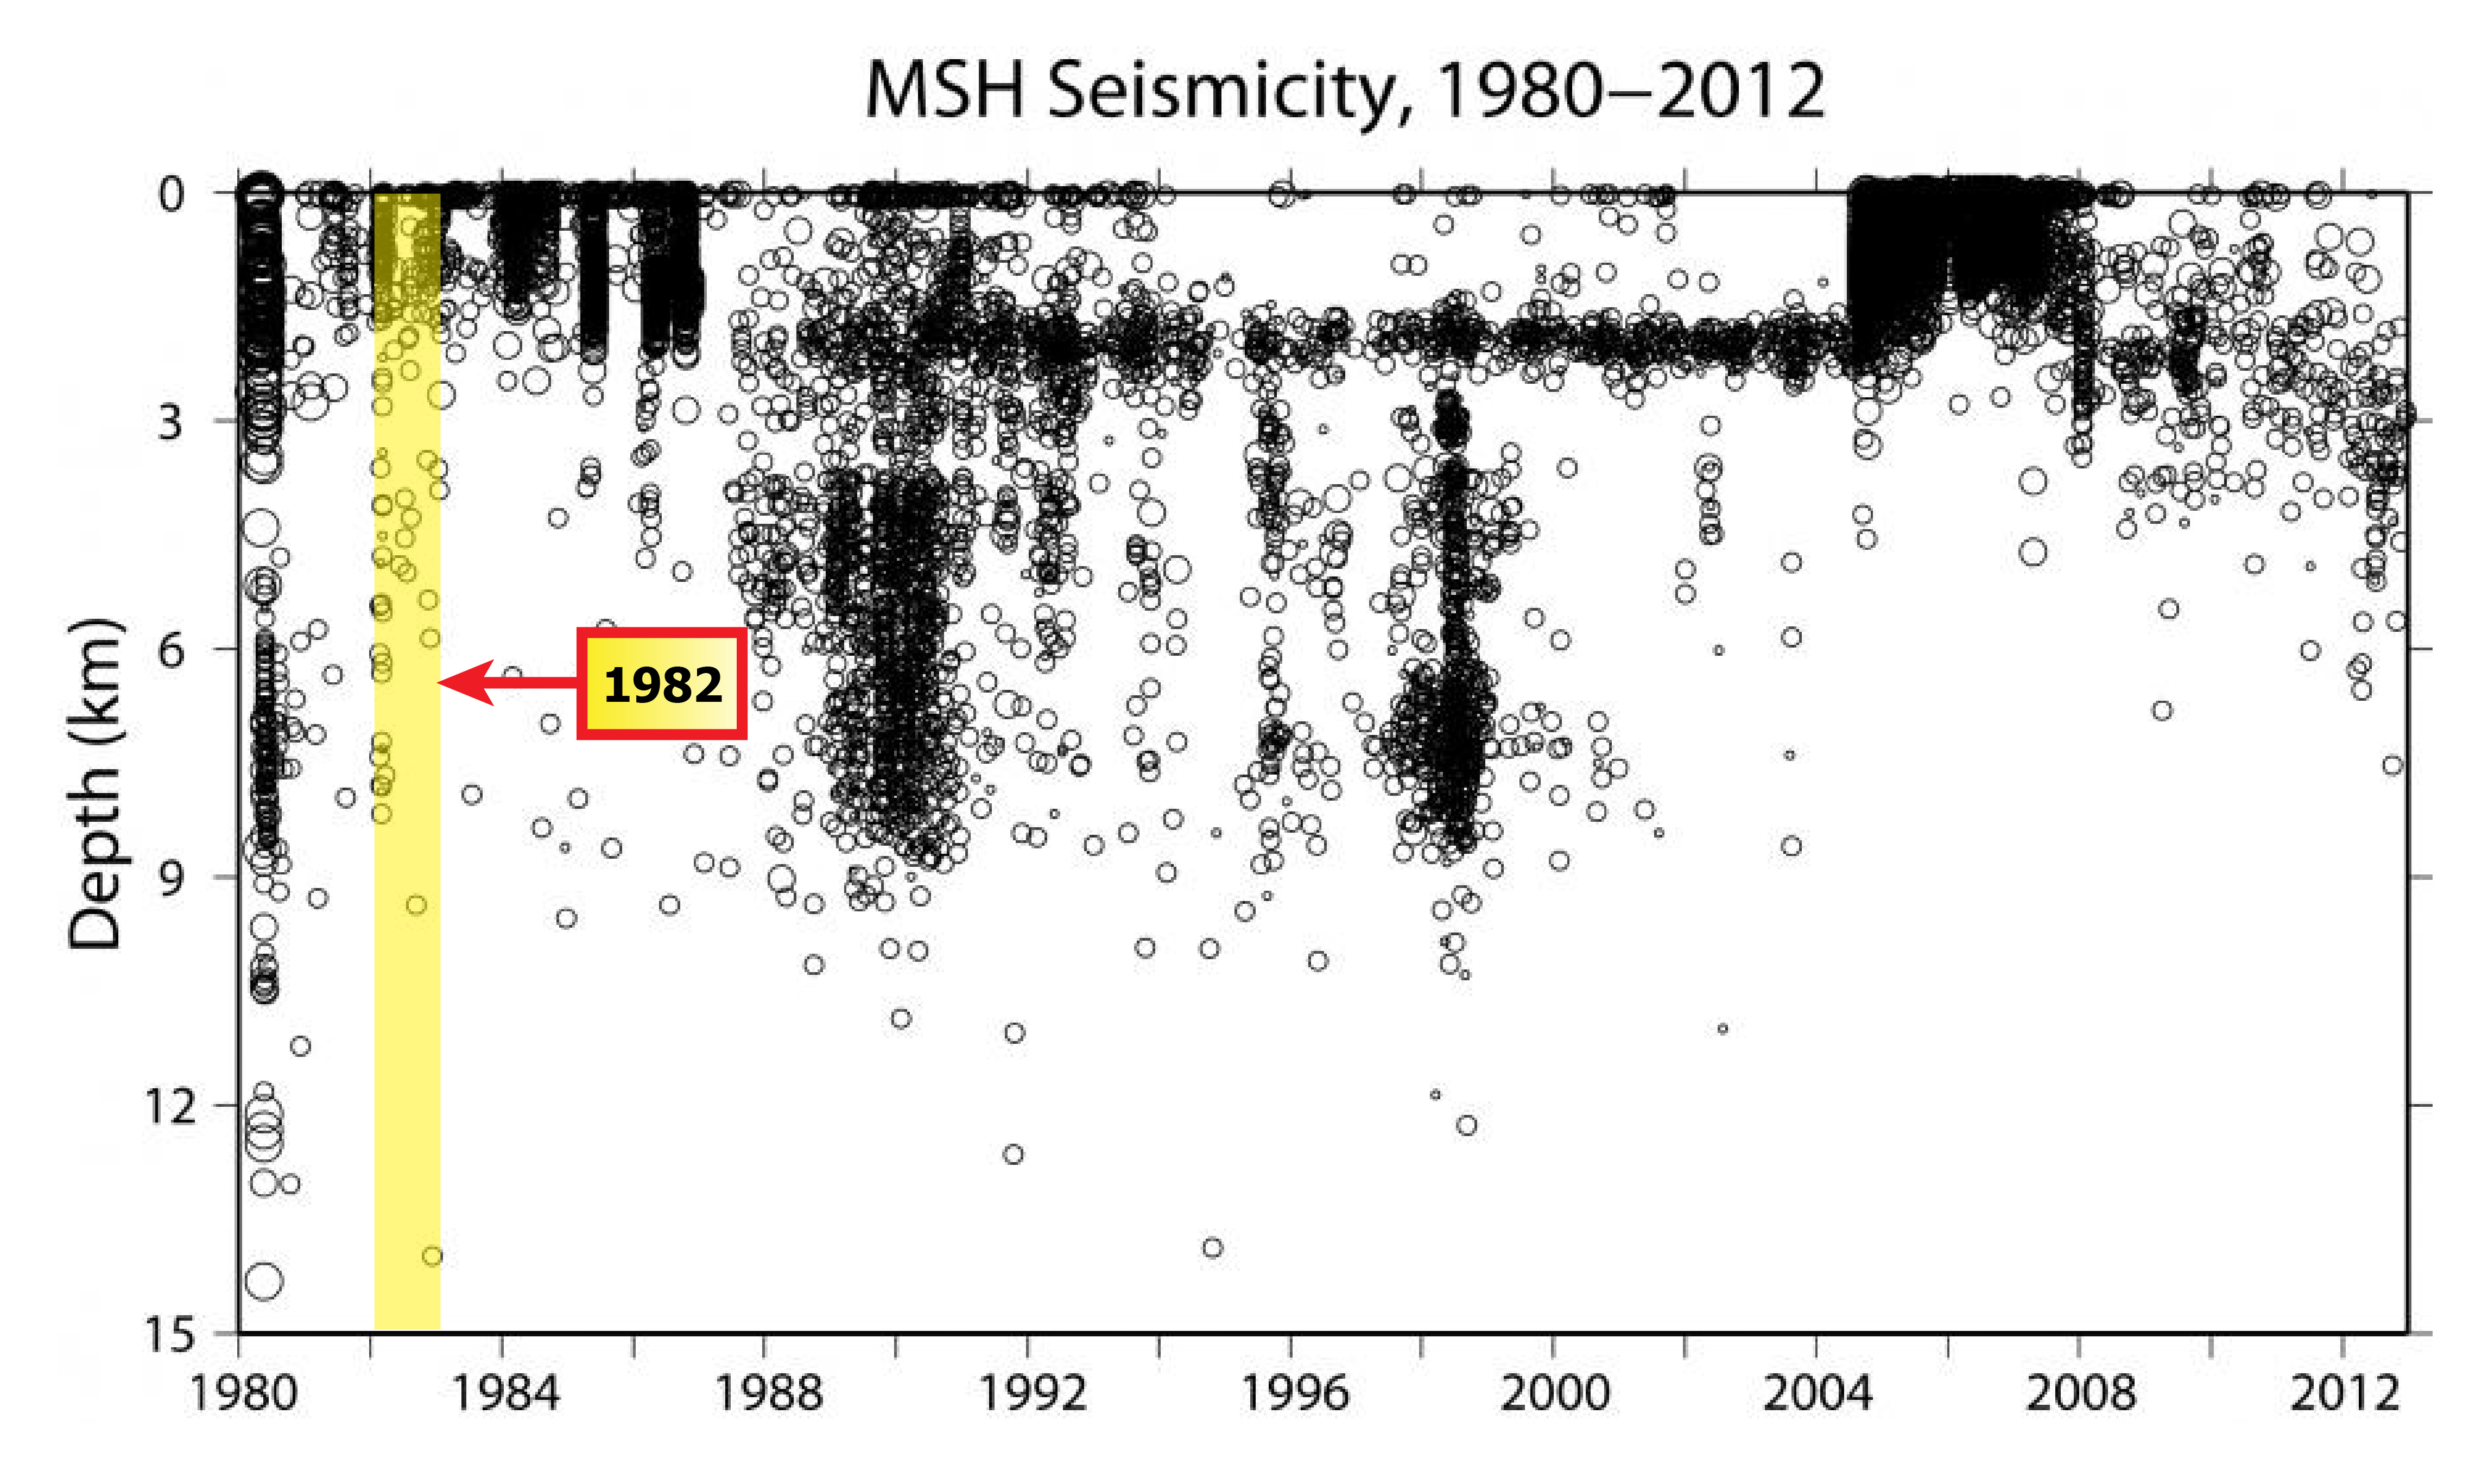
5 - Describe the pattern of seismicity observed in 1982. Were the earthquakes shallow, deep, or a combination of both? Were there more or less earthquakes as compared with the previous year (1981)?
So what actually happened during this time period?
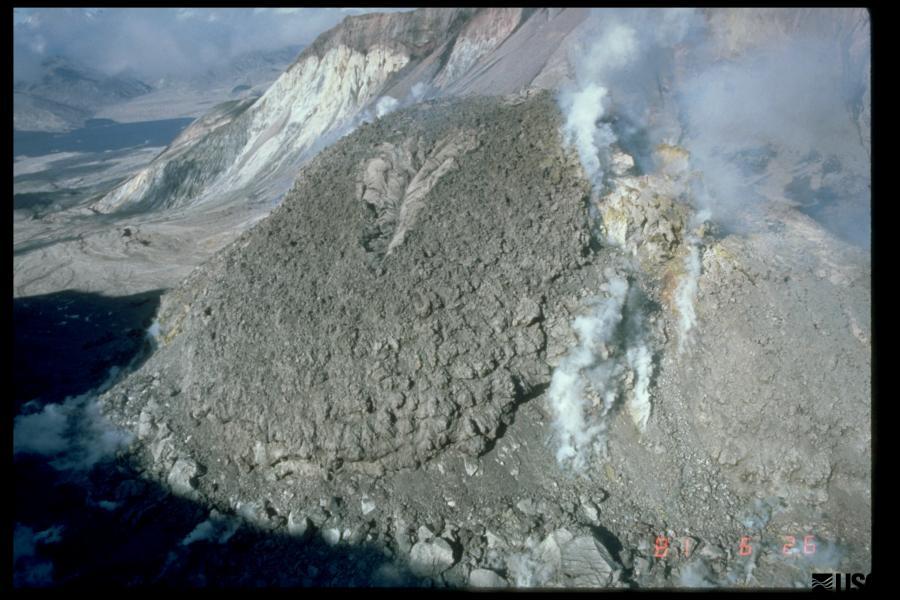
Figure 4: Mount St. Helens lava dome in 1981. Photo credit: USGS, Dan Dzurisin.
From 1980 to 1986, Mount St. Helens calmly erupted lava in slow-moving flows of thick, blocky lava. These lava flows piled up inside the crater, forming a lava dome. Eventually the lava dome grew to a height of 305 meters (about 1000 feet), which is almost as tall as the Empire State Building in New York City!
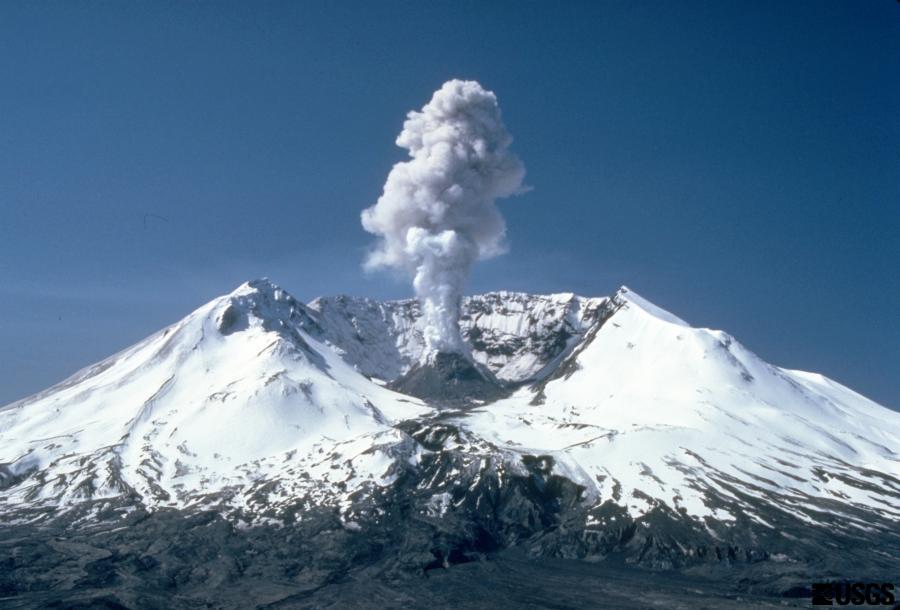
Figure 5: Plume of steam from Mount St. Helens in 1982. Photo credit: USGS, Lyn Topinka.
From 1980 to 1986, Mount St. Helens also erupted intermittently many times with gas and steam, most of which sent ash only a few hundred feet to a few miles above the volcano. All of these eruptions were much, much smaller than the May 18, 1980 eruption, which produced a column of ash that rose 15 miles above the volcano!
1998 Seismicity
Now you will analyze the pattern of Mount St. Helens seismicity observed in 1998. Look closely at Figure 6 below and answer Question 6.
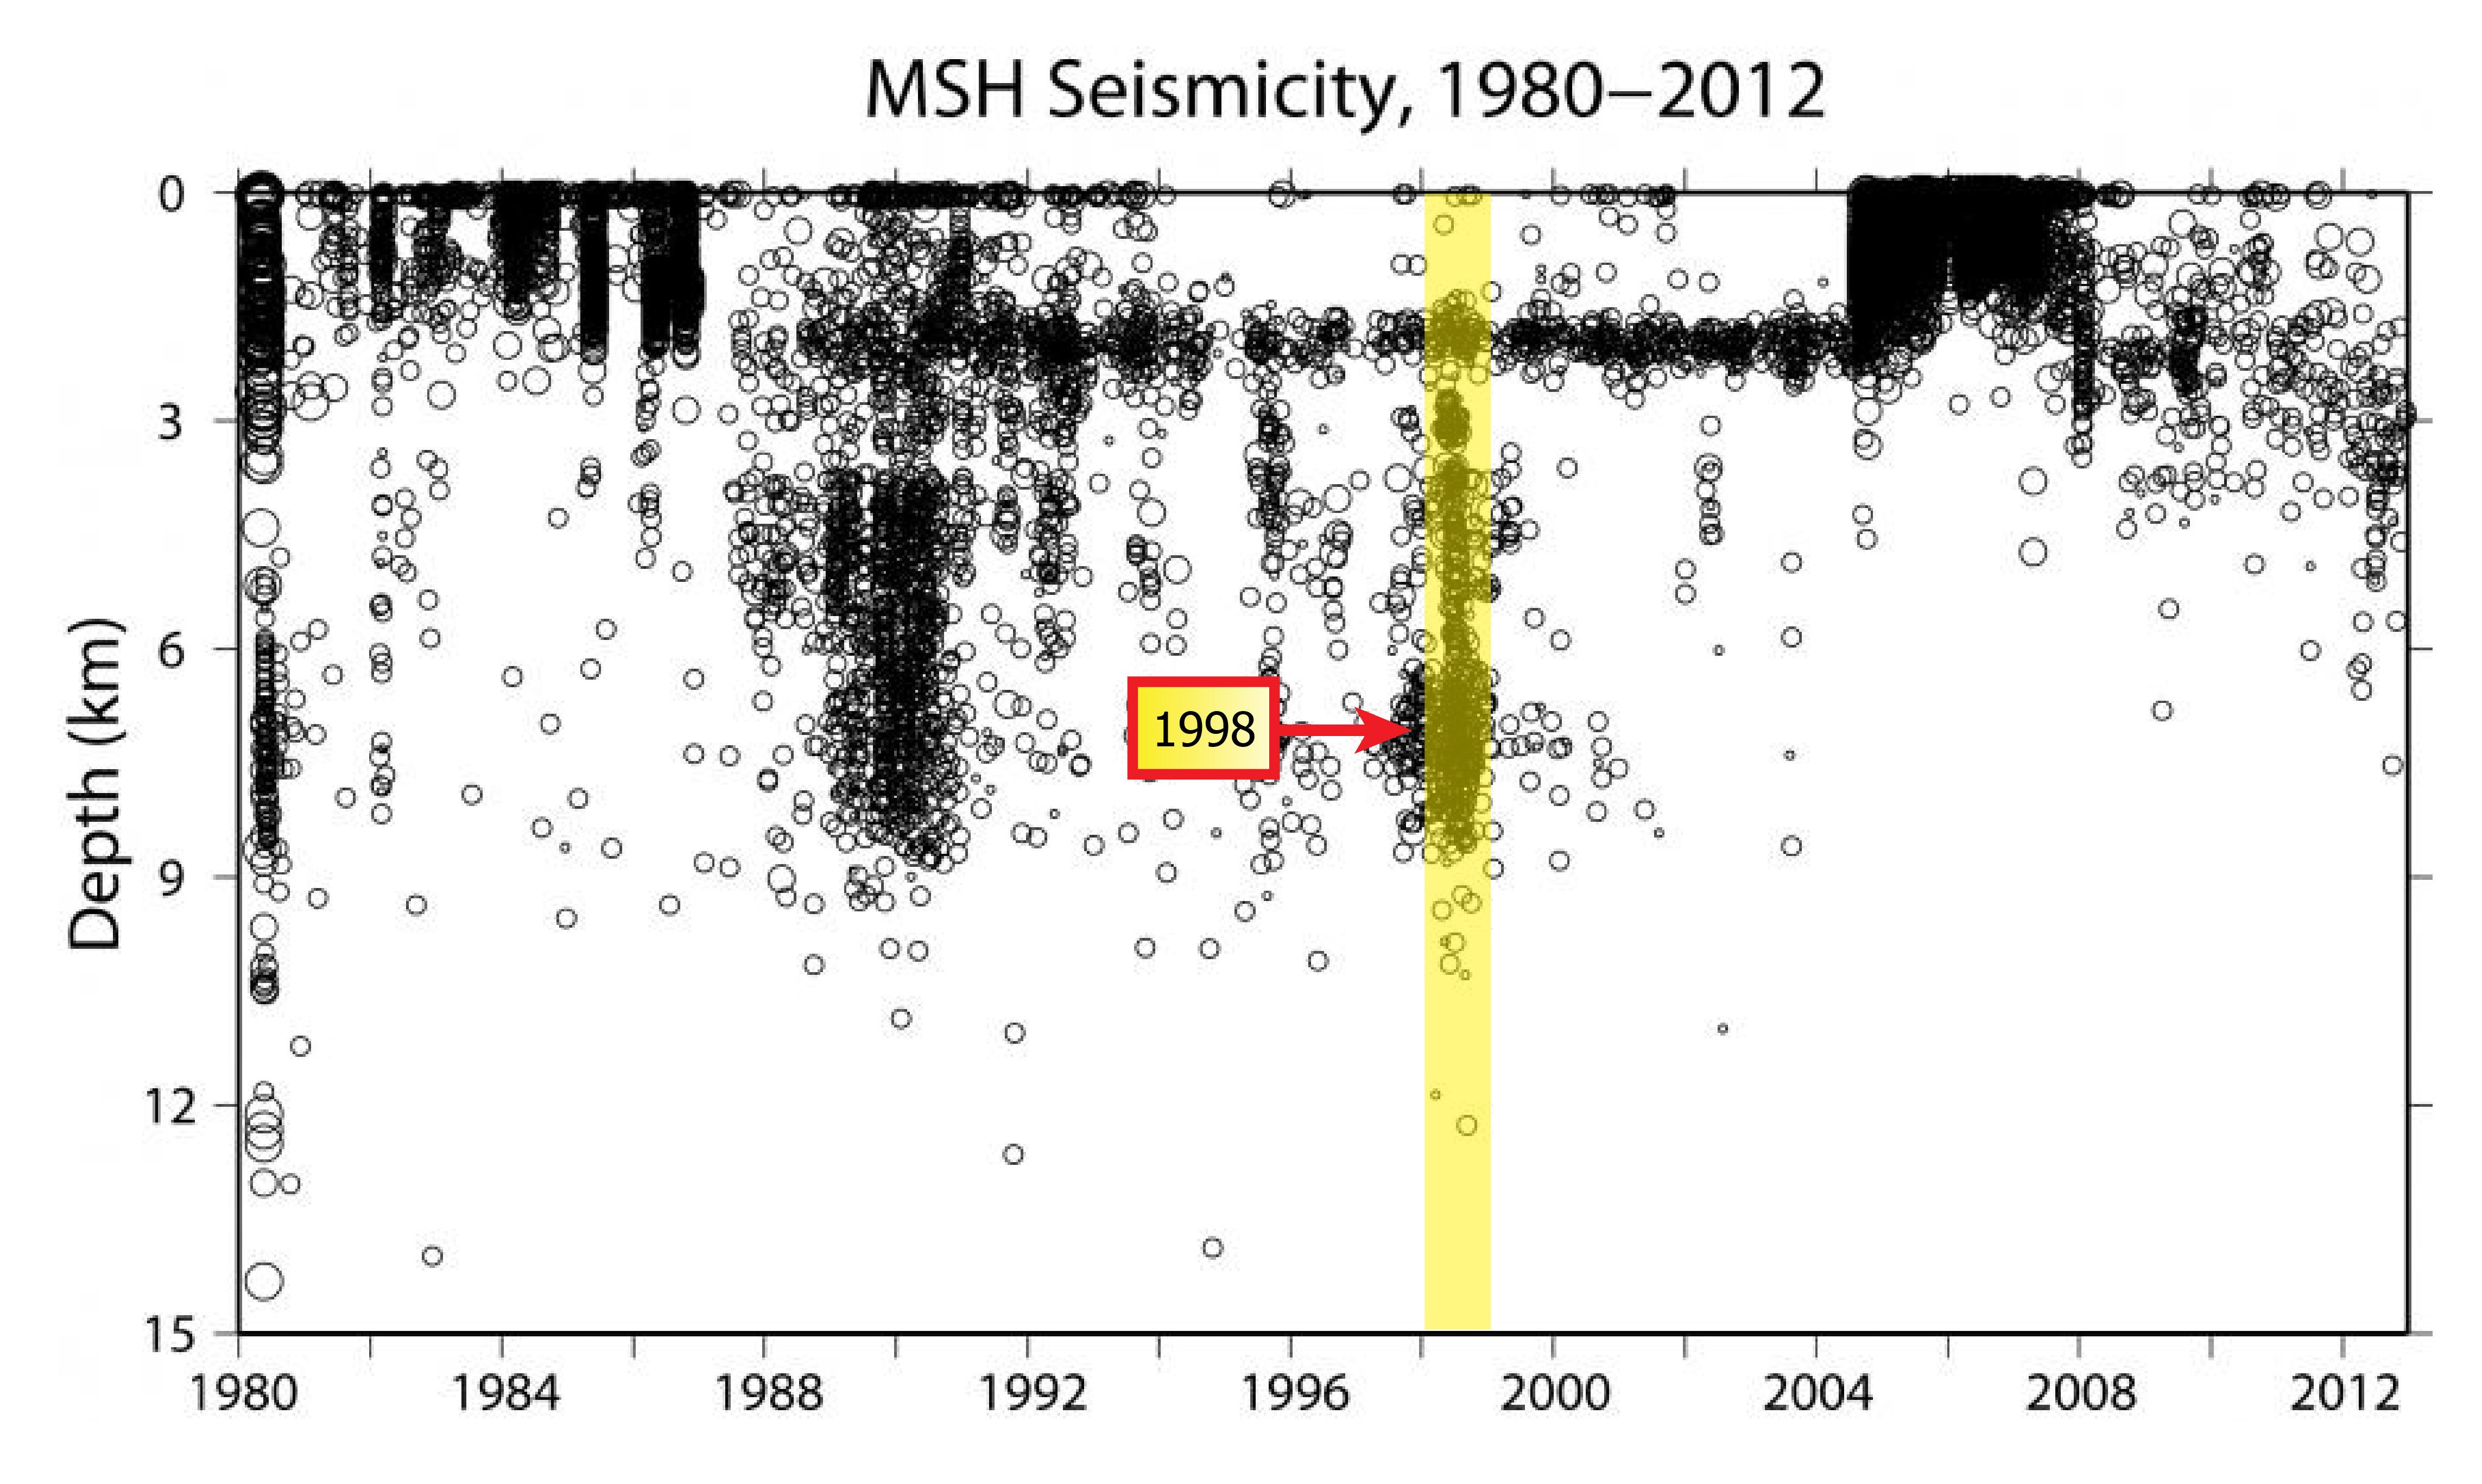
6 - What is the main difference in the pattern of the seismicity observed in 1998 as compared with what you observed in 1982? In your answer, include whether the amount of earthquakes increased or decreased and whether those earthquakes were deep, shallow, or both.
Click on the following link to see a report on the 1998 activity, including how scientists reacted to the change in seismicity. Answer Questions 7 and 8.
1998 Report
7 - What, according to the report, did scientists think was the reason for the increase in deep seismicity?
8 - What, according to the report, would have greatly increased the scientists' concern?
Ultimately no eruptions occurred as a result of the 1998 increase in seismicity.
2004 Seismicity
Now you will analyze the pattern of Mount St. Helens seismicity observed in 2004. Recall the patterns of seismicity in 1982 (which resulted in lava dome building and steam eruptions) and in 1998 (which resulted in no eruptions). Use Figure 7 below to answer Question 9.

9 - Do you think the seismic activity observed in 2004 was a sign that Mount St. Helens would erupt? Justify your answer using the patterns you see in the seismic data.
Now check out this video to find out what happened at Mount St Helens in 2004! Watch the video below and answer Question 10.
10 - What happened on October 1, 2004?
Congratulations!
You’ve completed your initial training and are now a part of the expert volcano monitoring team! You can now proceed to lessons on volcano deformation or gas emissions. If you’ve finished all three, let’s put all of this information to good use and help forecast if an eruption is likely to occur in this “Forecasting an Eruption” lesson!
This lesson was prepared through a collaborative effort by the Mount St. Helens Institute and the US Forest Service, Mount St. Helens National Volcanic Monument. Activity authorship and graphic design is by Sonja Melander (Mount St. Helens Institute), Phillip Wilson (Western Washington University), Peter Frenzen (US Forest Service), and Abigail Groskopf (Mount St. Helens Institute). Special thanks are due to Carolyn Driedger, Liz Westby, Seth Moran and Dan Dzurisin at the USGS Cascades Volcano Observatory for use of their data and for helpful reviews.
This project was made possible through the support of the US Forest Service’s Children’s Forest Program, Gifford Pinchot National Forest, Chevron, Gravitate and Mount St. Helens Institute donors.

