
Volcano Deformation
 Download
Student Worksheet
Directions
1. Download the worksheet using the link above.
2. Print a paper copy or open the .rtf file in your word processor.
3. Navigate through this activity by carefully reading everything and watching all of the videos.
4. When you see this symbol: ![]() take a minute to ponder the question asked.
take a minute to ponder the question asked.
5. When you see this symbol: ![]() write your answer on your worksheet or on a separate piece of paper.
write your answer on your worksheet or on a separate piece of paper.
6. If you are unsure what a word means, scroll over it to see its definition.
7. If you need to see a larger version of an image, click on it.
Let’s get started!

Mount St. Helens Science and Learning Center
You’ve been assigned to the Mount St. Helens Science and Learning Center to work with members of the volcano monitoring team from the USGS Cascades Volcano Observatory. You have a lot to learn because volcanoes are very complex, and there is no one thing that tells us everything we need to know about a volcano’s behavior. As a trainee, your job is to find out about volcano deformation and report what you have learned to the team. Deformation is a term used to describe changes in the shape of the surface of a volcanic landscape. Together with monitoring earthquakes (seismicity) and gas emissions, deformation can be an important indication of an approaching eruption.

Stop and Think: What could cause a volcano and the nearby land to change its shape?
Part 1. Introduction to Deformation
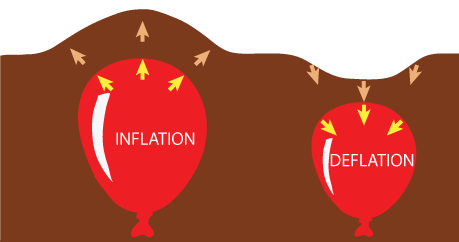
Figure 1: A cartoon showing the basic process of deformation of a volcanic landscape due to a change in the magma reservoir beneath it.
Deformation is the term used to describe changes in the shape of the surface of a volcano or the land around it. Imagine a giant, underground balloon that inflates as it fills with magma, as shown in Figure 1. This place within or beneath a volcano where magma is stored is called the magma reservoir. As the magma reservoir inflates, it pushes the overlying and surrounding ground up and out. Similarly, the ground around active volcanoes can swell (inflate) due to pressurization from magma below. Now imagine the same balloon deflating. The surface surrounding a volcano can also drop slightly (deflate) when the underlying magma depressurizes.
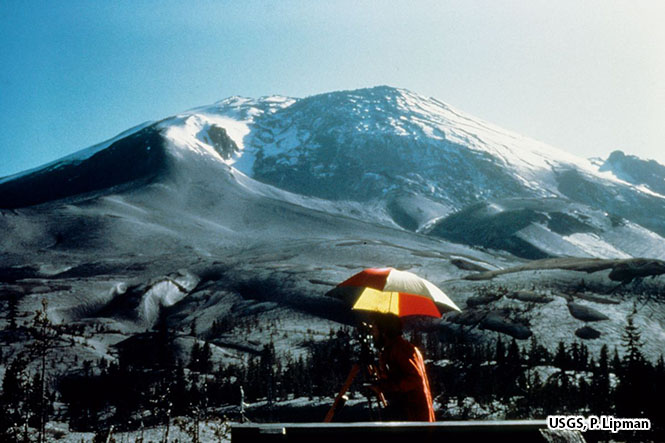
Figure 2: 1980 Mount St. Helens bulge or “cryptodome.” Photo credit: USGS, Peter Lipman.
Deformation monitoring is important because it can give scientists information about what is happening within a volcano. Figure 2 shows the famous 1980 “bulge” at Mount St. Helens. Before the May 18, 1980 eruption, fresh magma rose upwards in the volcano and pushed sideways, forming a 0.6 mile-wide bulge on the north side of the volcano. Scientists repeatedly measured these changes and found that the bulge was growing sideways at an astonishing rate of 5 feet per day! The bulge eventually collapsed on May 18, 1980, creating the massive landslide and infamous blast of the 1980 eruption.
Normally, deformation at active volcanoes usually happens gradually beneath the volcano resulting in very small (millimeter to centimeter scale) changes at the surface. Even when these changes are very small, they are still very important to detect because they can indicate whether the magma within the volcano is pressurizing or depressurizing. Such information can help scientists to forecast volcanic eruptions.
Part 2. Deformation Monitoring
To repeatedly measure and detect these small changes, scientists use specialized monitoring equipment. Watch the following video where USGS team member Dan Dzurisin will tell you about some of the equipment used to measure volcano deformation. Use the video to answer Questions 1 and 2.

1 - What did you find most interesting about the video?
2 - Describe in your own words what is happening in Figure 1 below.
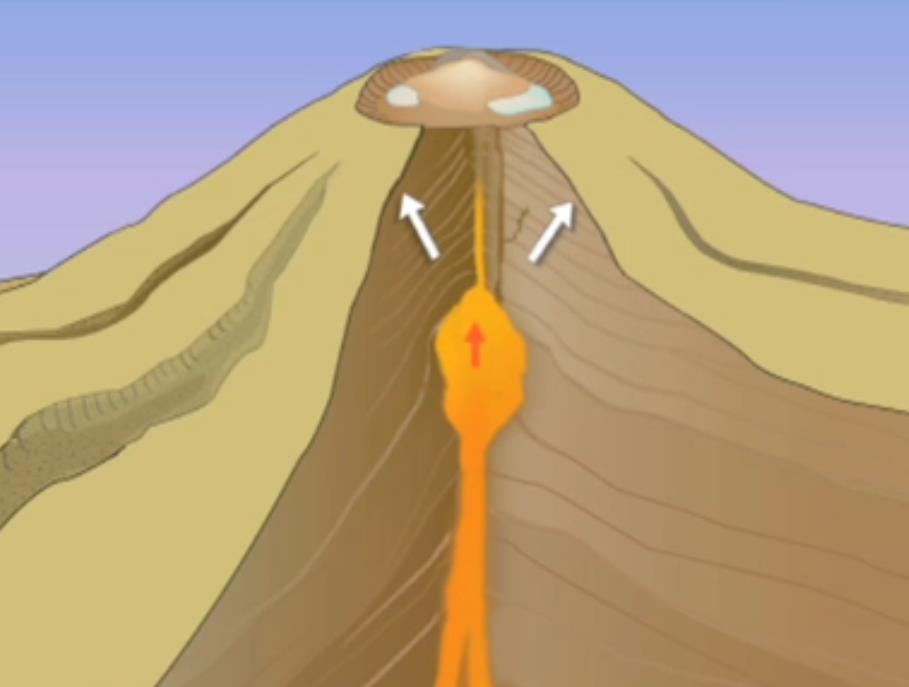
Figure 1: Volcano Deformation
In the video, USGS scientist Dan Dzursin mentioned briefly described how GPS devices and tiltmeters are used for deformation monitoring. Read the following information on different methods of measuring deformation and answer Question 3.
| Name | How equipment works | How deformation is measured |
Global Positioning System (GPS)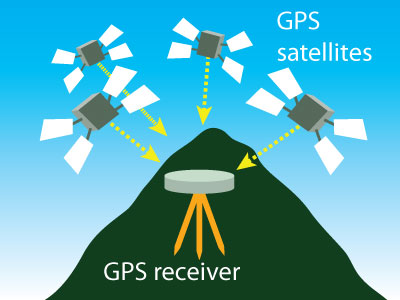 |
GPS devices commonly found in cell phones and in cars are used to find someone’s location and provide directions. Similarly, scientists can use GPS to precisely measure changes in the position of a GPS receiver. GPS devices work by receiving signals from a network of GPS satellites, which are constantly orbiting the planet. These satellites transmit information about the satellite’s position at an exact time. If a GPS device receives this information from at least four satellites, it is able to determine the distance and angle to each satellite and precisely calculate its position on the surface of the earth. |
Scientists use GPS to precisely measure changes in the position of fixed points on the ground surface and reveal the rate and direction in which the deformation is occurring. |
Tiltmeter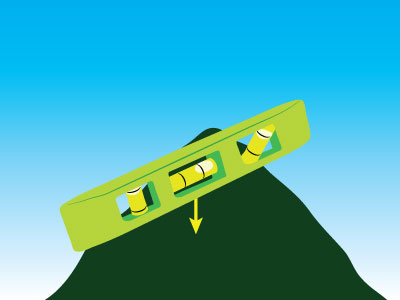 |
A tiltmeter is similar to a level used for carpentry, with a small device filled with fluid and a bubble. The bubble is in the center when it is level and moves when it is tilted. By filling the tiltmeter with a fluid that conducts electricity and placing electrodes along the length of the tiltmeter, the tiltmeter generates an electrical signal that corresponds with the direction and degree of tilt. | The voltage of the electric signal depends on the angle of the tiltmeter. By measuring the voltage of the tiltmeter, scientists are able to know the angle and degree to which the ground surface is tilting. |
Electronic Distance Meter (EDM) |
A reflective device (a mirror) is placed on the ground surface of the volcano. Far away, an EDM is pointed towards that reflective device. The EDM shines a laser, the light is bounced back by the reflector, and the EDM receives the the light. | By calculating the amount of time it takes for the laser beam to return to the EDM, scientists are able to calculate the distance between the EDM and the reflector. If this distance changes, deformation is happening! |
3 - Choose one of the techniques that scientists use to measure deformation described above (GPS, tilt, or EDM). In your own words, explain how the technique you selected is used to measure volcano deformation.
Part 3. Measure Tilt

Figure 5: Tiltmeter installation in the crater of Mount St. Helens on 9 June 1982 . Photo credit: S.R. Brantley
Recall that tiltmeters are used to measure the orientation (angle) of the ground surface. This angle is called “tilt” and is measured in relation to the consistently flat line of the distant horizon that is used as the point of reference. Let’s practice making some tilt measurements!
Use Figures 6, 7, and 8 below to answer Questions 4 to 7. Figure 6 shows the horizon, which has a tilt of 0 degrees. Click on each figure to make it larger.
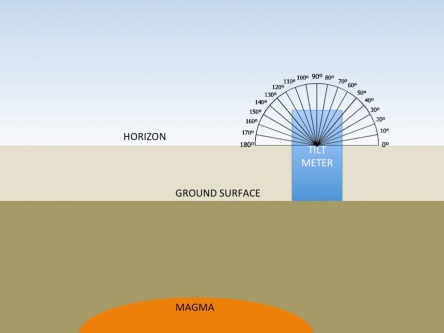


Figure 6 Figure 7 Figure 8
4 - What is the measured tilt (in degrees) in Figure 7?
5 - What is the measured tilt (in degrees) in Figure 8?
6 - Which Figure (7 or 8) shows a bulge (swelling of the ground surface or inflation) compared to Figure 6?
Part 3. Analyze Tilt Data
In the previous questions we used degrees to measure the angle of tilt. However, scientists typically use units of microradians instead of degrees to measure very small changes in tilt. The reason for this is that there are 17,453 microradians in just 1 degree. Using this different unit just makes it easier to detect tiny changes in the tilt of the ground surface.

Figure 9: Comparison between degrees and microradians
The following graph shows data from a tiltmeter at Kilauea, an active volcano in Hawaii. We will use this data to help us understand how deformation is related to volcanic eruptions. Each volcano symbol (![]() ) represents an eruption at Kilauea. Use the graph in Figure 10 below to answer Question 8.
) represents an eruption at Kilauea. Use the graph in Figure 10 below to answer Question 8.

7 - Describe the pattern that you see in the graph of Figure 10. Does the line get steeper or less steep before an eruption?
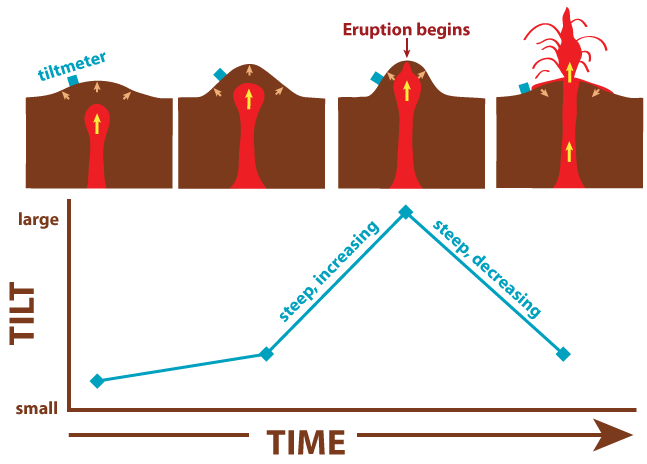
Figure 11: Cartoon showing the relationship between ground deformation (tilt) associated with volcanic eruptions. Not to scale.
As magma rises, it can bulge the ground surface of the volcanic landscape. A rapid increase in tilt (represented by a steep, increasing curve or line on the graph) is a good clue that magma is rising to the surface and that it is more likely that an eruption might happen soon. An increasing tilt is usually steepest just before an eruption.
A rapid decrease in tilt (represented by a steep, decreasing curve or line on the graph) can occur immediately at the start of an eruption. The ground surface’s tilt decreases (becomes less steep) as a response to the release of pressure by the eruption.
The following graph contains data from a tiltmeter at Mount St. Helens. Use the graph in Figure 12 below to answer Questions 9 and 10.

8 - Does the steepness of the tilt measurement graph in Figure 12 change? If so, when does it get the steepest?
9 - Based on the tilt measurement data, do you think it is likely that an eruption might occur in late March? Explain why or why not.
The combination of deformation, gas emissions, and seismicity data led scientists to issue progressively increasing levels of eruption warnings on March 12, March 15, and again on March 19. On the evening of March 19, Mount St. Helens had a small explosion, shortly followed by lava dome growth.
Congratulations! 

You’re now part of the expert team on volcano deformation! You can now proceed to lessons on seismicity or gas emissions. If you’ve finished all three, let’s put this information to good use and help decide if an eruption is likely to occur in this “Forecasting an Eruption” lesson!
This lesson was prepared through a collaborative effort by the Mount St. Helens Institute and the US Forest Service, Mount St. Helens National Volcanic Monument. Activity authorship and graphic design is by Sonja Melander (Mount St. Helens Institute), Phillip Wilson (Western Washington University), Peter Frenzen (US Forest Service), and Abigail Groskopf (Mount St. Helens Institute). Special thanks are due to Carolyn Driedger, Liz Westby, Seth Moran and Dan Dzurisin at the USGS Cascades Volcano Observatory for use of their data and for helpful reviews.
This project was made possible through the support of the US Forest Service’s Children’s Forest Program, Gifford Pinchot National Forest, Chevron, Gravitate and Mount St. Helens Institute donors.

